


Why Is It So Hard To Stay Consistent?
"Success isn't always about greatness. It's about consistency. Consistent hard work leads to success. Greatness will come." - Dwayne Johnson
Success is about consistency. It's about moving forward doesn't matter whats the pace. We all know the right from our childhood.
Yet, staying consistent feels next to impossible. Whether it is studying or going to the gym, consistency is one superpower we all wish we had.
So, Why Is It So Difficult To Stay Consistent?
The answer lies in how you define consistency.
For most of the students, staying consistent means studying for a certain number of hours every single day.
For example - Suppose you are preparing for a competitive exam ( like USMLE, NEET, PLAB, etc.) and decide that you will study for 4 hours every day to get a good score. You would consider yourself consistent if the study graph looked something like this-
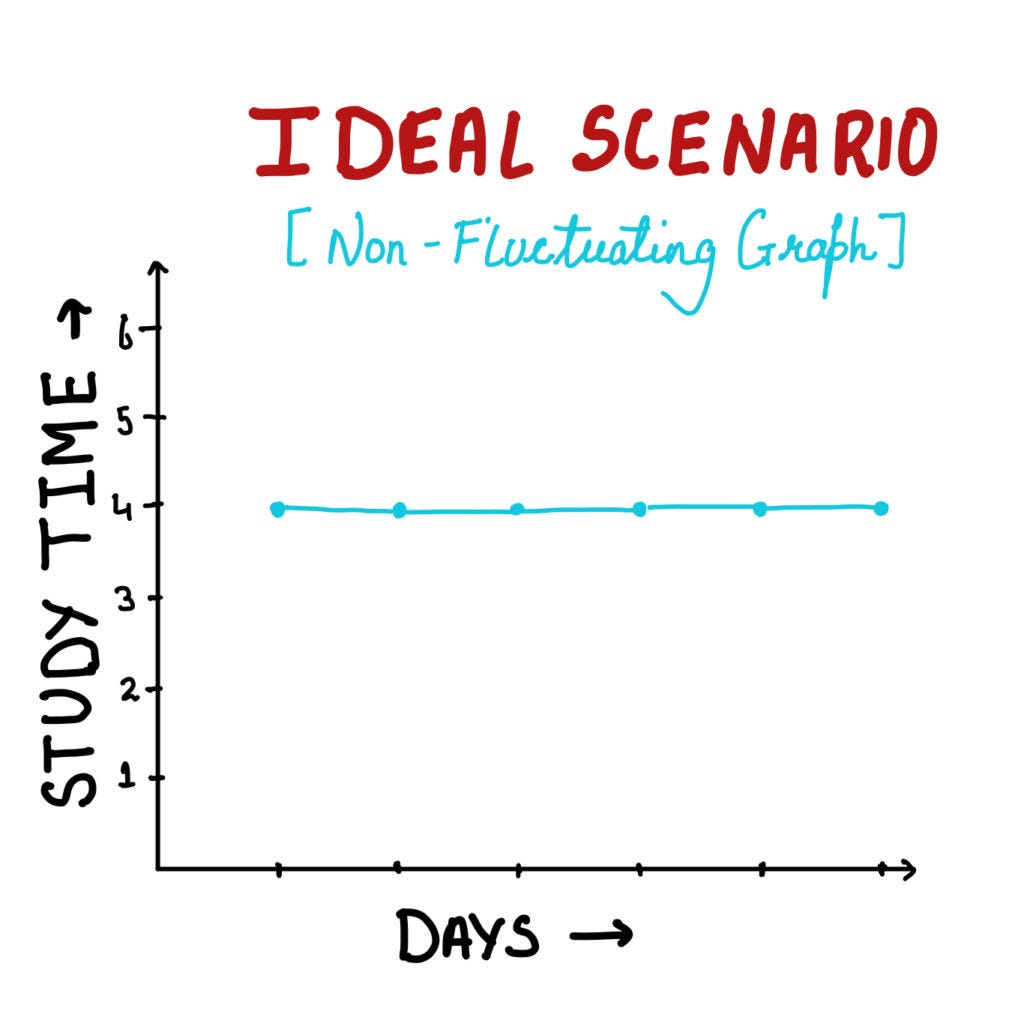
But this definition is fundamentally and statistically incorrect. That would be possible only in an ideal scenario, which is impossible to achieve.
Why?
Because in reality, there are so many factors that directly or indirectly affect your graph (i.e., your studies). You can control some of them like distractions from your smartphone or noisy dorm rooms. Some, you simply can't. Power cuts, illnesses, headaches, sleep issues, family issues, partner issues are some of the examples.
Statistically, these unavoidable factors constitute a part of Random variance or Random Error. These are the factors that are there just by Chance. You can never eliminate these random variances from your life. Now whether these random variances/chances go in or against your favor is entirely dependent on your LUCK.
So, in reality, the graph will be like this -
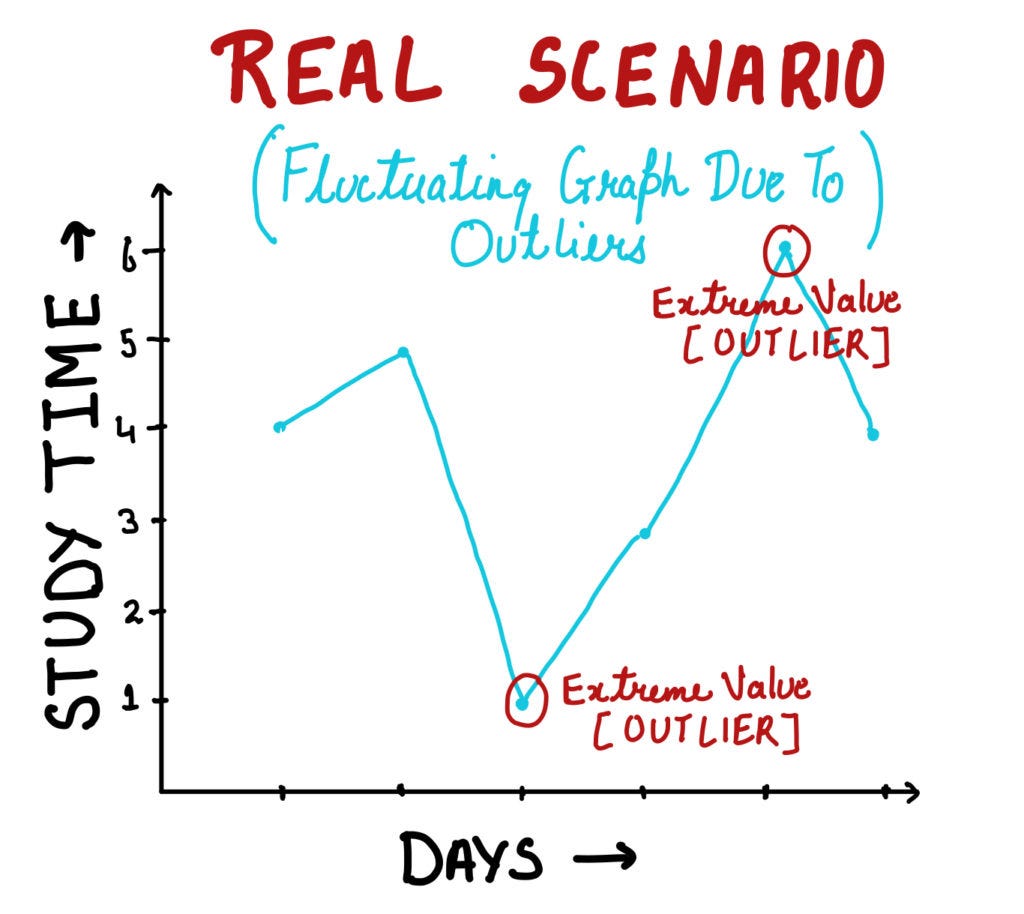
When we say that everyone has good days and bad days, it merely means that some days these Random Variances are in your favor, and some days they are not.
But Does That Mean You Cannot Be Consistent?
No.
The chances are that you are already consistent in your studies. But, you perceive that you are inconsistent because of the extreme values in your graph.
Let me explain.
Let's say; this is how you spent your last week studying for exams (your target was 4 hours every day) -
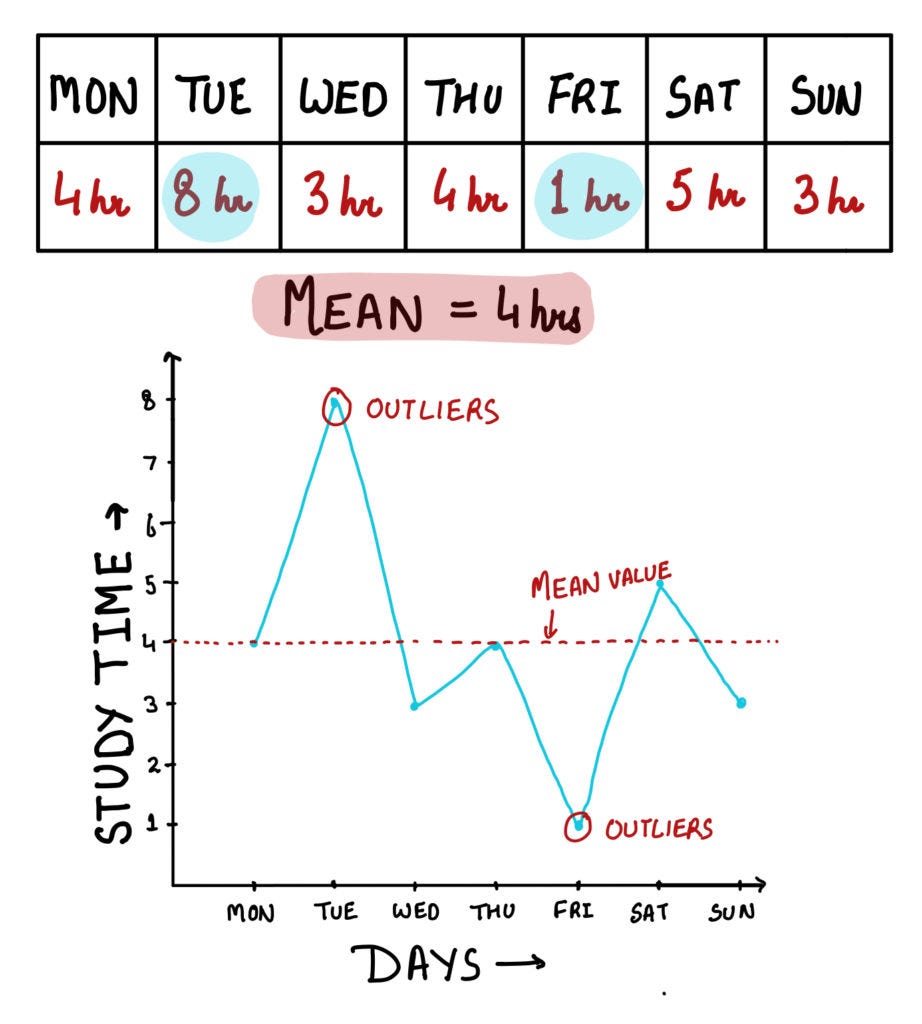
If I take the mean number of hours you spent studying, it would be 4hrs which is what you had targeted, but does that graph look consistent to you. It is very likely that after studying for 8 hours on Tuesday, you must have felt quite happy about your progress only to feel sad the next day because you studied only for 3 hours. The same applies for Friday and Saturday, where you feel demotivated at first but happier afterward.
That is how we perceive inconsistencies on a day to day basis. Because of these extreme values, you ignore the fact that you have already achieved that 4-hour mark. There is this feeling that you are not working at your full potential (8hr in our example) on the other days and only if you were consistent enough, you would achieve everything you need. But, reaching your full potential is possible only when the random variations/chances/luck/odds are in your favor.
All of the above scenarios can be explained statistically by the concept of Regression to Mean.
Regression To Mean
It means that "Whenever there is an imperfect correlation between two entities, the values tend to regress towards the mean."
Can you predict with surety, how many hours you will study the next day by your present-day performance?
Is there a perfect correlation between Age and Intelligence of a person?
No.
These are some examples of imperfect correlations. One of the reasons for these imperfections is random variances or chances or, in simple words Luck.
Regression to mean simply says that whenever random variations play a role in the outcome, the extreme values would regress towards the mean baseline value. Neither you can study for 8 hours daily, nor you would stay in the 1-hour mark, and the graph would eventually move towards the mean i.e., 4 hours.
Not just studies, regression to mean applies to almost anything in this world. It is a universal statistical phenomenon. The problem is that our intuitive mind tries to find a reason or causality for these extreme values or outliers when none exists.
Daniel Kahneman, a Nobel laureate and author of the book "Thinking Fast and Slow" has explained it with this example.
Suppose, in a golf game between two players of equal caliber, on day 1, one player performs exceptionally well and the other one quite poorly than his usual. Based on these performances, how do you predict they will perform on day 2. Of course, we expect the first player to perform well still and vice versa. But, as it happens, the first player plays worse the next day and the second player improves dramatically. Can you explain that?
One would think that the first player became too overconfident and the second player thinking that he had nothing to lose, gave his best shot. That is how our brain tries to formulate a CAUSALITY. But in reality, these are just the products of random variances or Luck, which is unpredictable and is never the same for everyone, every day. On day 1, the odds were in favor of the first player, but on day 2, the second one had better Luck.
That's how the noble laureate came up with this equation for success
Success = Skill + Luck
In this imperfect world, with so many variances, your progress is bound to regress towards the mean. It's just universal, and there is no explanation/causality.
How Do We Measure Consistency Then?
It's simple. By focusing on the mean value and not on the extreme values or day to day variations. Trying to form causality from day to day data is one of our cognitive biases, and you can not eliminate that. But, by carefully setting the parameters for consistency from day to day variations to the mean value, you can start to observe a bigger picture free from the bias. Here is an example -
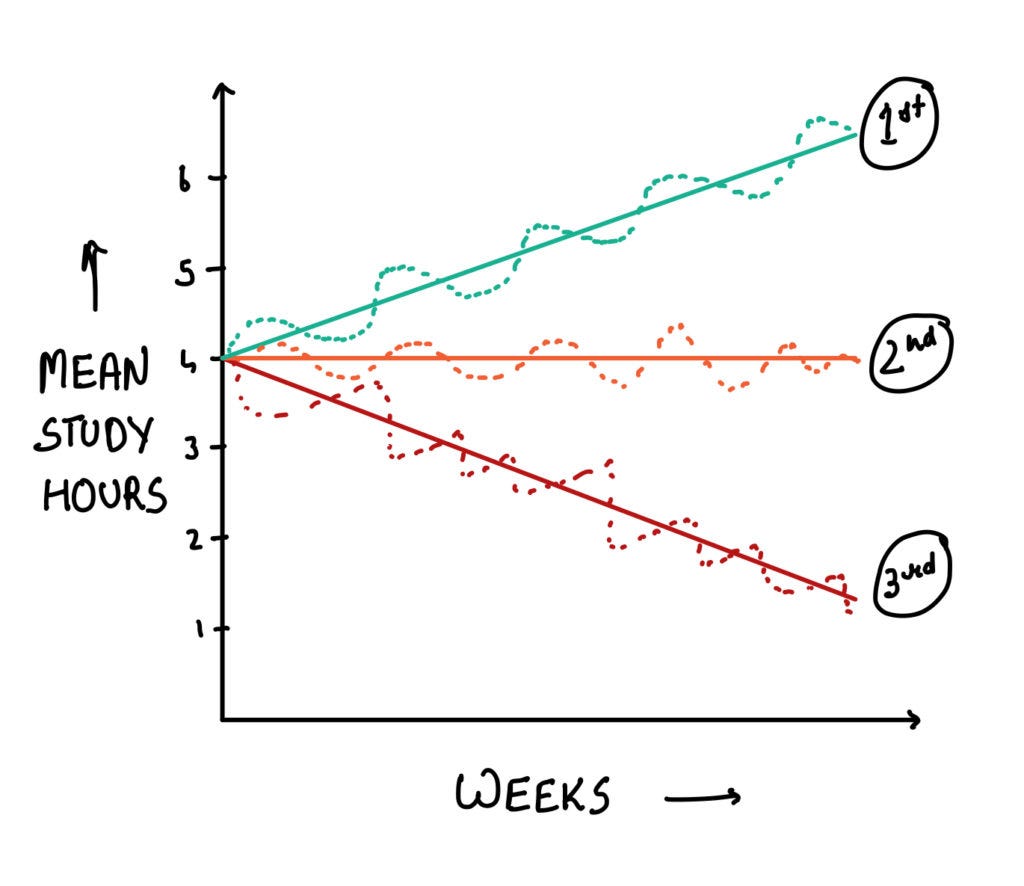
The graph shows the weekly mean study time per week for three students. You can see that the mean study hours of 1st student is CONSISTENTLY increasing, for 2nd student it's flat and for 3rd student, it is consistently decreasing.
Because, there is less impact of Radom variances on these mean values, tracking our progress with this parameter gives us a less fluctuating graph and better feedback of our work. (Although, there will be a regression to mean in these values also)
When you see that your mean graph is falling, its an indication that you have to work harder, and when you see it rising, it tells you that you are on the right path.
What To Do When Your Graph Is Falling / Your Consistency Is Falling?
Mean (Average) = Sum total of all the values / Total number of values
If you can increase the sum (numerator), naturally, the mean will increase. If your mean study hours are falling, it indicates that you will have to study more hours next week and stay on the higher end of the spectrum.
To Summarise
Most of the time, especially while studying, we perceive that we are not putting in all the efforts, and we are inconsistent because we cannot study the same number of hours every day.
This perception arises because we ignore a very important determinant called Random variances / Luck.
It is a universal truth that the values will regress towards the mean. But because of our ignorance of this statistical phenomenon, we tend to find the cause of our day to day variations, appreciating our success and cursing ourselves for the failures. This is a cognitive bias.
Thus, if we can blunt down the effect of this bias and track our progress with the mean value, it will give us a better overall picture of our performance.
Ignorance is the reason; we can feel miserable, which can make us more stressed, anxious, and even depressed.
The purpose of this article is just to make you aware of this bias. I know it is next to impossible, tracking these mean values and plotting it on a graph when you have so much to study.
But, your journey in medical school or any exam preparations is a long and tiring one. There will be setbacks, and those are just outliers. The problem starts when you start overthinking about these and try to search for a cause.
So, don't fall into this trap of perceived inconsistencies. Keep calm and carry on.
Recommended Readings -
Thinking Fast And Slow - Daniel Kahneman
The Art Of Thinking Clearly - Rolf Dobelli